


Bar Charts and Types of Data
(KS2, Year 4)
-
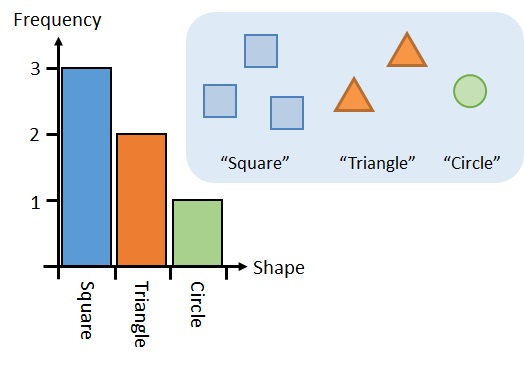
Bar charts can present qualitative data (which is described in words).
The bar chart shown below shows the number of shapes:
-
Bar charts can present quantative data (which is described in numbers).
Quantitive data can be discrete or continuous:
-
Discrete data can only take certain values
The bar chart shown below shows the test scores (out of 10) of a class of students. The test scores can only be whole numbers, so they are discrete:

-
Continuous data can take any value (within a range).
The bar chart shown below shows the heights of a group of friends. Heights can take any value within a range, so they are continuous:
 Note: There are no gaps between the bars because continous data has no gaps in it.
Also note: A histogram is a type of bar chart for continuous data.
Note: There are no gaps between the bars because continous data has no gaps in it.
Also note: A histogram is a type of bar chart for continuous data.
-
Discrete data can only take certain values
The bar chart shown below shows the test scores (out of 10) of a class of students. The test scores can only be whole numbers, so they are discrete:
What Is a Bar Chart?
A bar chart (or bar graph) is a chart which uses bars to present data. The height of each bar shows how often (the frequency) each value appears in the data.What Is Data?
Data is a set of facts (such as numbers, measurements or words) that have been collected or measured. Data can be reported, visualized and analyzed to help us learn and make decisions.
This page was written by Stephen Clarke.
Worksheet
This test is printable and sendable


