


Making a Cumulative Frequency Table
(KS3, Year 7)
Making a Cumulative Grouped Frequency Table
A cumulative grouped frequency table is a great way to present a lot of data. Imagine a teacher wanted an easy way to present the test scores of their mathematics class: Depending on each student's test score, the teacher will assign a grade:
How to Make a Cumulative Grouped Frequency Table
Making a cumulative grouped frequency table is easy.Question
Construct a cumulative grouped frequency table for the numbers below.Step-by-Step:
1
Construct a table with four columns:
 Before we make a cumulative grouped frequency table, we need to make a grouped frequency table (the first three columns).
Read about how to make a grouped frequency table
Before we make a cumulative grouped frequency table, we need to make a grouped frequency table (the first three columns).
Read about how to make a grouped frequency table
Before we make a cumulative grouped frequency table, we need to make a grouped frequency table (the first three columns).
Read about how to make a grouped frequency table
2
In the Score column, write the groups of numbers. In our example, we will use the group of test scores assigned to the different grades.

3
Go through the set of numbers in the Question. For each number, see which of the group of numbers it belongs in. Cross it out and put a tally mark in the Tally column, in the row for that group of numbers.
-
The first number is 2. It belongs in the 1 - 5 group. Cross it out and put a tally mark in the Tally column in the 1 - 5 row.

-
The second number is 10. It belongs in the 6 - 10 group. Cross it out and put a tally mark in the Tally column in the 6 - 10 row.

-
Continue until all numbers have been crossed out and had tally marks placed in the Tally column.

4
For each row, count the tally marks. Write the number of tally marks in the Frequency column.

5
Complete the Cumulative frequency column. The cumulative frequency in each row is found by adding all the entries in the Frequency column from the top row to that row.
-
The cumulative frequency in the first row is equal to the frequency:

-
The cumulative frequency in the second row is found by adding the frequency in this row to all the frequencies above:
 Note: It is also found by adding the frequency in this row to the cumulative frequency above.
-
The cumulative frequency in the third row is found by adding the frequency in this row to all the frequencies above:
 Note: It is also found by adding the frequency in this row to the cumulative frequency above.
Answer:
The cumulative grouped frequency table is complete when all the cumulative frequencies have been entered: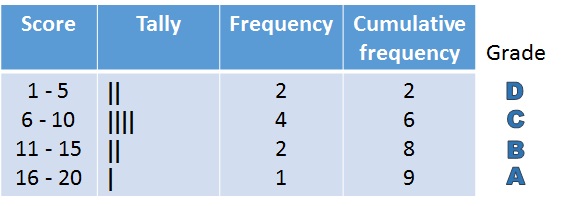

This page was written by Stephen Clarke.
What Are Tally Marks?
Tally marks are a way of helping you to count, especially when you have to count a large set of numbers. A vertical line is made for the first four numbers:


 To make five, a diagonal bar is drawn across the four vertical lines:
 Once ten is reached, two groups of five tally marks are used:
 Finally add, the number of single marks:
 There are 22 tally marks.
Top Tip
Quick Check
The final entry in the Cumulative frequency column must equal the total of the Frequency column. Add up the Frequency column to see if it is the same as the last number you write in the Cumulative frequency column:
The Cumulative Frequency Is Increasing
The numbers in the Cumulative frequency column must increase as you go down the rows. This is because each time you go down a row, you add another frequency to the running total, so it must get larger.
Sometimes a the cumulative frequency will stay the same. What must the frequency be in that row?
This is because each time you go down a row, you add another frequency to the running total, so it must get larger.
Sometimes a the cumulative frequency will stay the same. What must the frequency be in that row?

