


Reading from a Bar Chart
(KS2, Year 4)
 We can read the heights of the bars to find out how many students preferred each colour.
How to Read from a Bar Chart
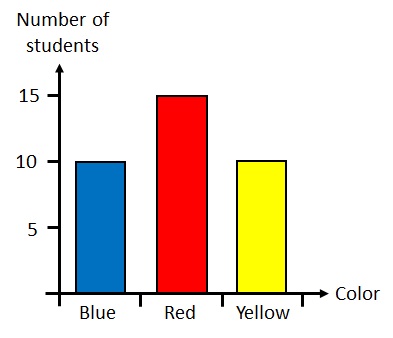
Reading from a bar chart is easy. The values in our data set are shown along the horizontal axis. In our example, these are the favorite colours of the students. How many times each value appears in our data set (the frequency) is shown along the vertical axis. In our example, these are how many students prefer a colour. The height of the bar above each colour tells us how many students prefer that colour.Question
The bar chart below shows the favorite colours of students in a class. How many students prefer each colour?
Step-by-Step:
1
Look at the first colour. In our example, it is Blue.
Read off the height of the bar above the colour. In our example, the height is 10.
 10 students' favorite colour is blue.
10 students' favorite colour is blue.
2
Look at the next colour. In our example, it is Red.
Read off the height of the bar above the colour. In our example, the height is 15.
 15 students' favorite colour is red.
15 students' favorite colour is red.
3
Look at the next colour. In our example, it is Yellow.
Read off the height of the bar above the colour. In our example, the height is 10.
 10 students' favorite colour is yellow.
10 students' favorite colour is yellow.
Answer:
We have read off the bar chart:- 10 students' favorite colour is blue.
- 15 students' favorite colour is red.
- 10 students' favorite colour is yellow.
Interactive Widget
Here is an interactive widget to help you learn about reading from a bar chart.What Is a Bar Chart?
A bar chart (or bar graph) is a chart which uses bars to present data. The height of each bar shows how often (the frequency) each value appears in the data.
This page was written by Stephen Clarke.
Worksheet
This test is printable and sendable


